Add your own data
Get your spreadsheet, shapefile or export onto the map.
You've got a file — a spreadsheet from a colleague, an export from another mapping tool, a download from an open-data portal — and you want to see it on a map. That's what Add Layer is for: point GeoCanvas at your file, give it a name, and it lands on the canvas, ready to colour and share.
Where to start
Click Upload
In the map editor, click Upload in the toolbar — it also lives inside the Add Layer dialog. That dialog is the one place you bring new data in, so whenever you want something new on the map, this is where you begin.
Two ways in
Choose a file, or paste a link
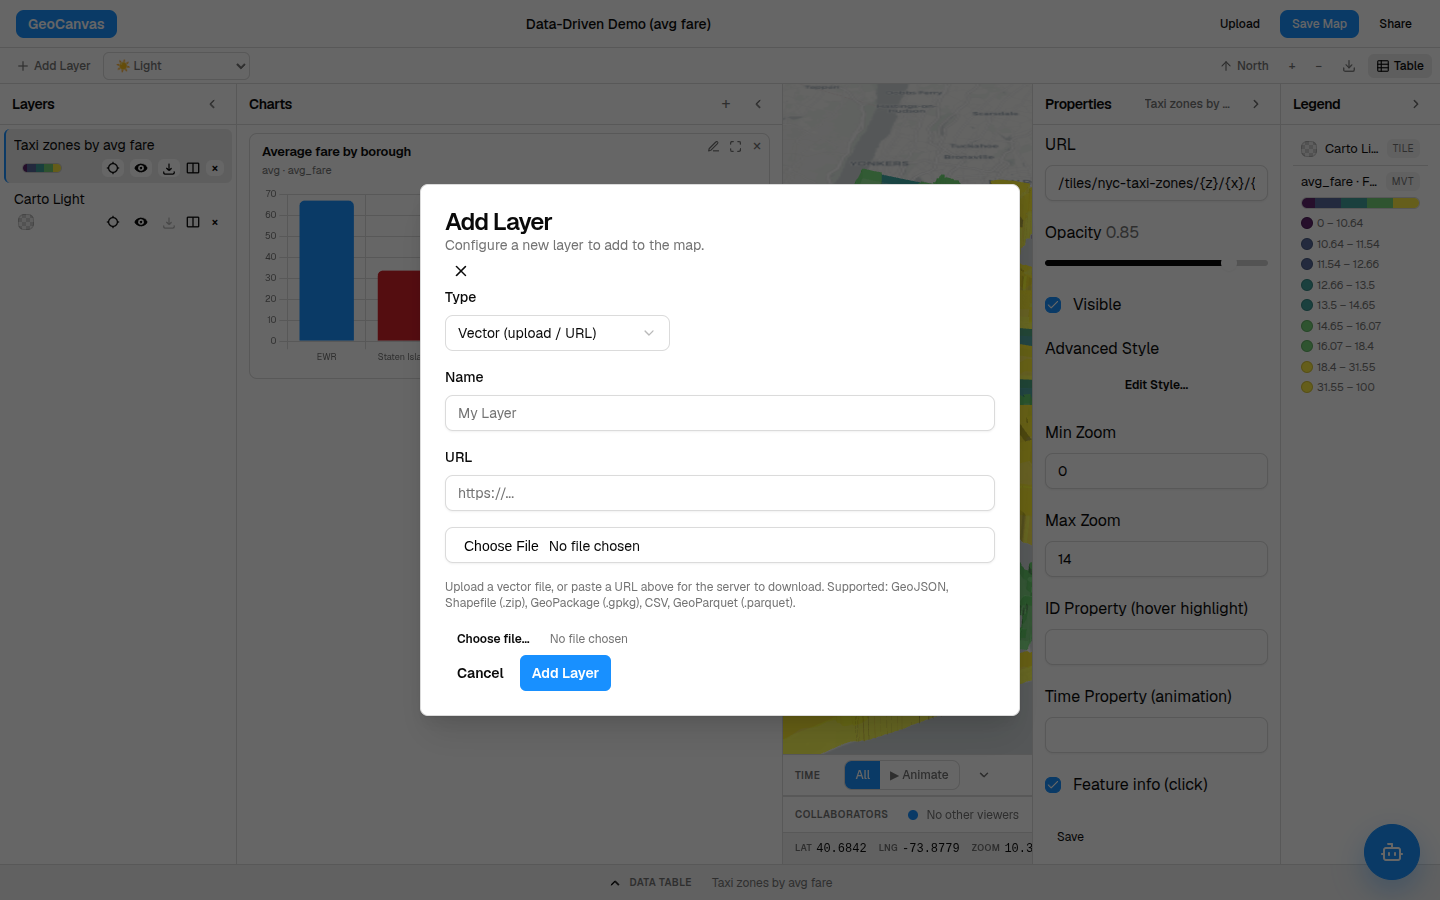
The dialog gives you two ways to hand over your data:
- Choose a file from your computer — the ordinary file picker you already know.
- Paste a link to a file that already lives online, and GeoCanvas fetches it for you — handy for data on an open-data portal you'd rather not download first.
Give it a name you'll recognise later — NYC Taxi Zones, Store locations, whatever the data is — then click Add. That's the whole flow.
What works
The kinds of files you can bring in
Most spatial files just work. You can bring in:
- A spreadsheet (a CSV) — with a column of coordinates, or even a column of plain addresses (more on that below).
- A GeoJSON file.
- A shapefile — the zipped bundle you get from most GIS tools.
- A GeoPackage, plus a few other common mapping exports.
Not sure yours is on the list? The full rundown is in Supported formats.
No coordinates in your spreadsheet, just addresses? GeoCanvas places each one on the map for you as it uploads — you don't have to look up latitude and longitude yourself.
The wait
Big files take a moment
Most files appear within a few seconds. A very large one — hundreds of thousands of shapes, or a long list of addresses to place — can take a little longer, so give it a moment to finish. When it's ready, the map zooms to fit your new data and it shows up in the Layers panel on the left.
Try it
Put a layer on the map
- Open the dialog. Click Upload in the editor toolbar.
- Choose your data. Pick a file from your computer, or paste a link to one online.
- Name it. Type a name you’ll recognise, like NYC Taxi Zones.
- Add it. Click Add and give it a moment to load.
- See it. Your data appears on the map and in the Layers panel. Now colour it by a number to make it tell a story.
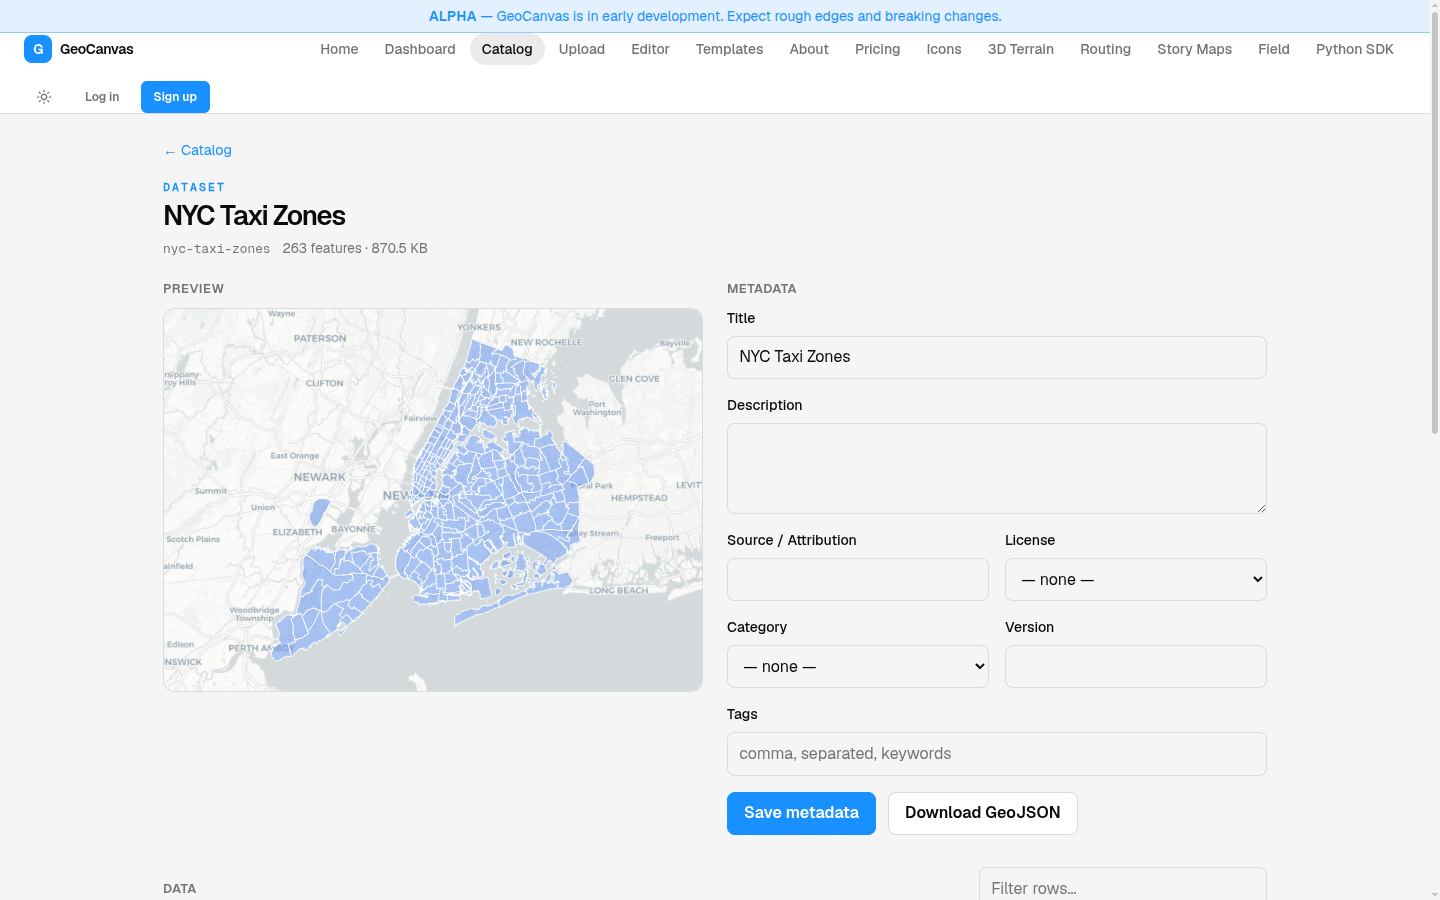
This is exactly how the NYC Taxi Zones layer used throughout these guides got onto the map — 263 neighbourhood zones, each carrying its average taxi fare. See the finished result on the live example map.
Saved for reuse
Add it once, use it anywhere
Every file you bring in is saved to your catalog, so you never upload the same thing twice. Open its catalog page to see a preview, write a description in your own words, and look over its rows — then drop the very same dataset onto any other map in a couple of clicks.
Browse everything you've added in the data catalog, or read The data catalog to see how reusing a dataset works. Ready to make your fresh layer say something? Head to Styling layers.