Create your first map
From nothing to a styled, shareable map in a few minutes.
You want one real map made and shared today — something you can hand a colleague, not a tutorial you half-finish. Good news: it's four small moves. Open the editor, add some data, colour it so a pattern jumps out, and copy a link. A few minutes, start to finish. We'll build the NYC Taxi Zones map that runs through the rest of these docs, but the moves are exactly the same for your own data.
Want to see where you're headed first? Open the finished example map — 263 New York taxi zones shaded by their average fare. Looking around needs no account at all; building your own starts with a sign-in link emailed to you — no password to invent.
The walkthrough
Make a map in four moves
Each step is a click or two. The three sections below zoom in on the moves with the most to see.
- Open the editor. Sign in (a one-click link lands in your email) and your dashboard appears — first visit sets up your team, which starts with a Demos project of example maps. Click New Map and give it a name. It opens to a blank basemap with an empty Layers panel on the left.
- Add your data. In the Layers panel, click Add Layer. Either choose a file from your computer or pick a ready-made dataset from the catalog — for this map, pick NYC Taxi Zones. The zones drop onto the map.
- Colour it. Select the layer, click Edit Style…, and colour by the average fare. The flat zones become a map you can read at a glance.
- Share it. Click Save, then Share, switch on anyone with the link can view, and copy the link. That link opens your map for anyone you send it to.
Add data
Bring your own, or borrow ours
The Add Layer window is where data comes in, and you have two easy paths: drop in a file from your computer, or pick something already in the catalog and skip the wait entirely.
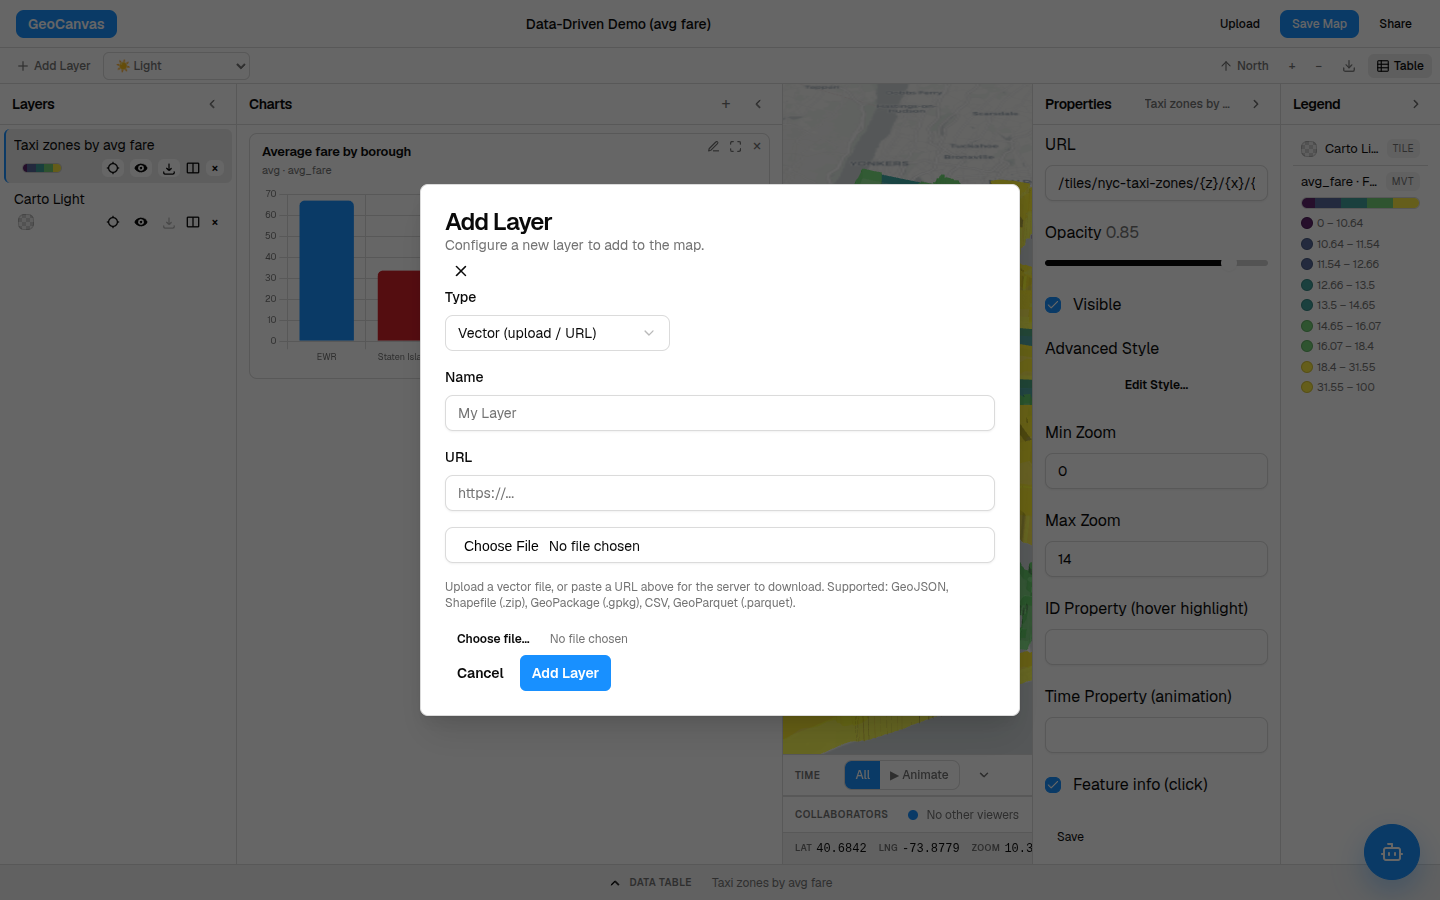
Got your own map data — a GeoJSON, a Shapefile, a spreadsheet of places? Choose the file and GeoCanvas brings it onto the map; a large file can take a moment to get ready. The full list of what you can bring in lives in Upload your data, and The data catalog covers reusing one dataset across many maps.
Colour it
Make the pattern show
A single flat colour says nothing. The move that earns its keep is colouring each zone by a number — here, the average taxi fare — so the expensive corners of the city light up. Select the layer, click Edit Style…, and point the fill at the average fare.
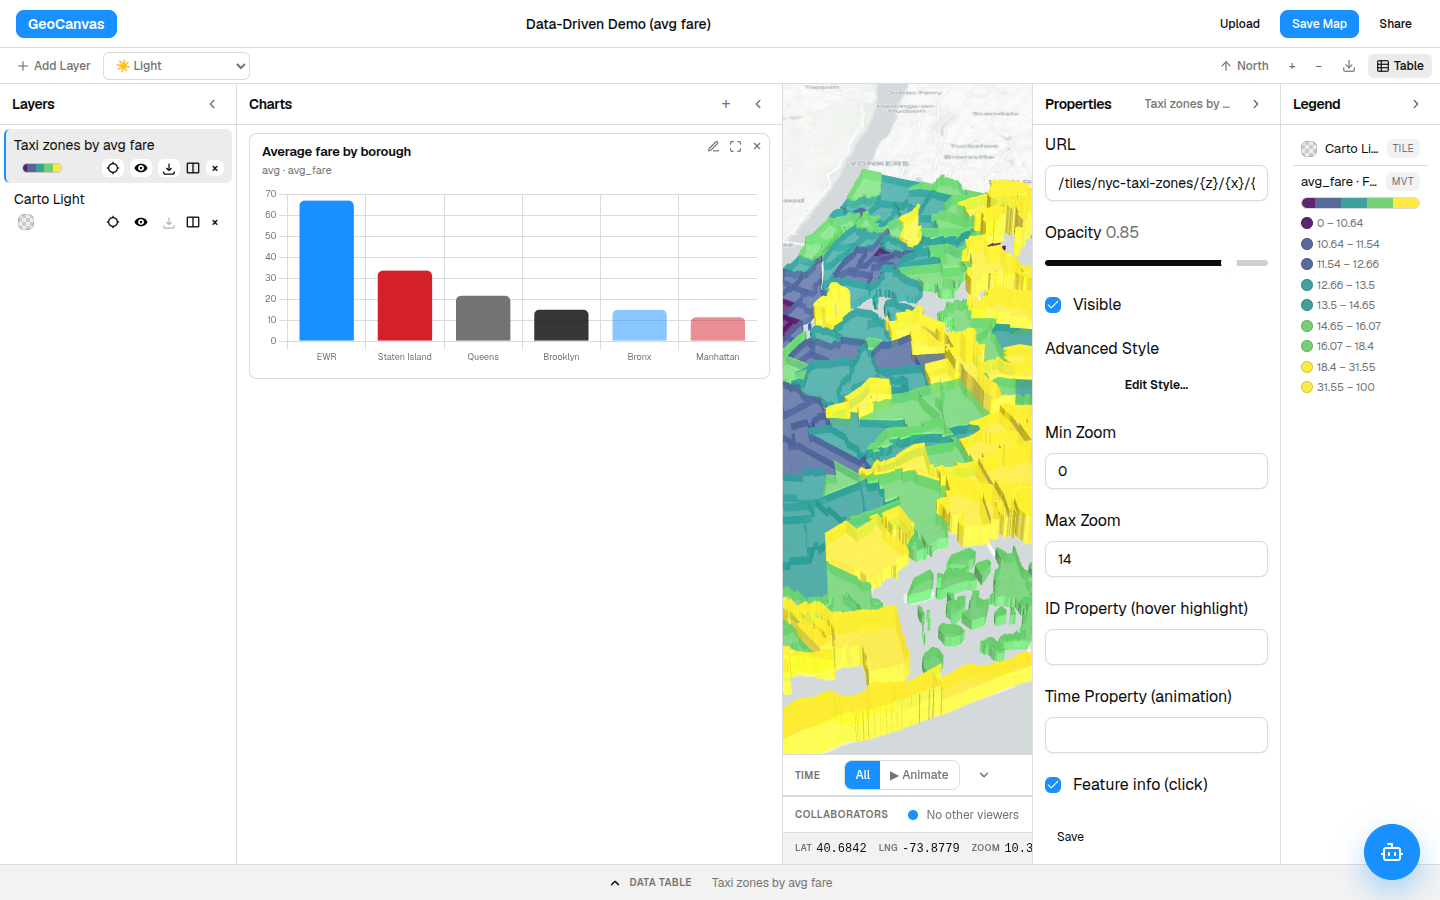
The legend on the right writes itself to match, so anyone can tell what the colours mean. Want to go further — split the colours differently, or raise the high zones into 3D? That's all in Styling layers. Prefer to just ask a question in plain English, like "Which zones have the highest average fares?" Try GeoChat.
Share
Hand someone a link
Click Save in the top bar first, then Share. Switch on anyone with the link can view and copy the link — it opens a clean, branded page with just your map on it. There's also a ready-made snippet you can paste to drop the live map straight into your own website.
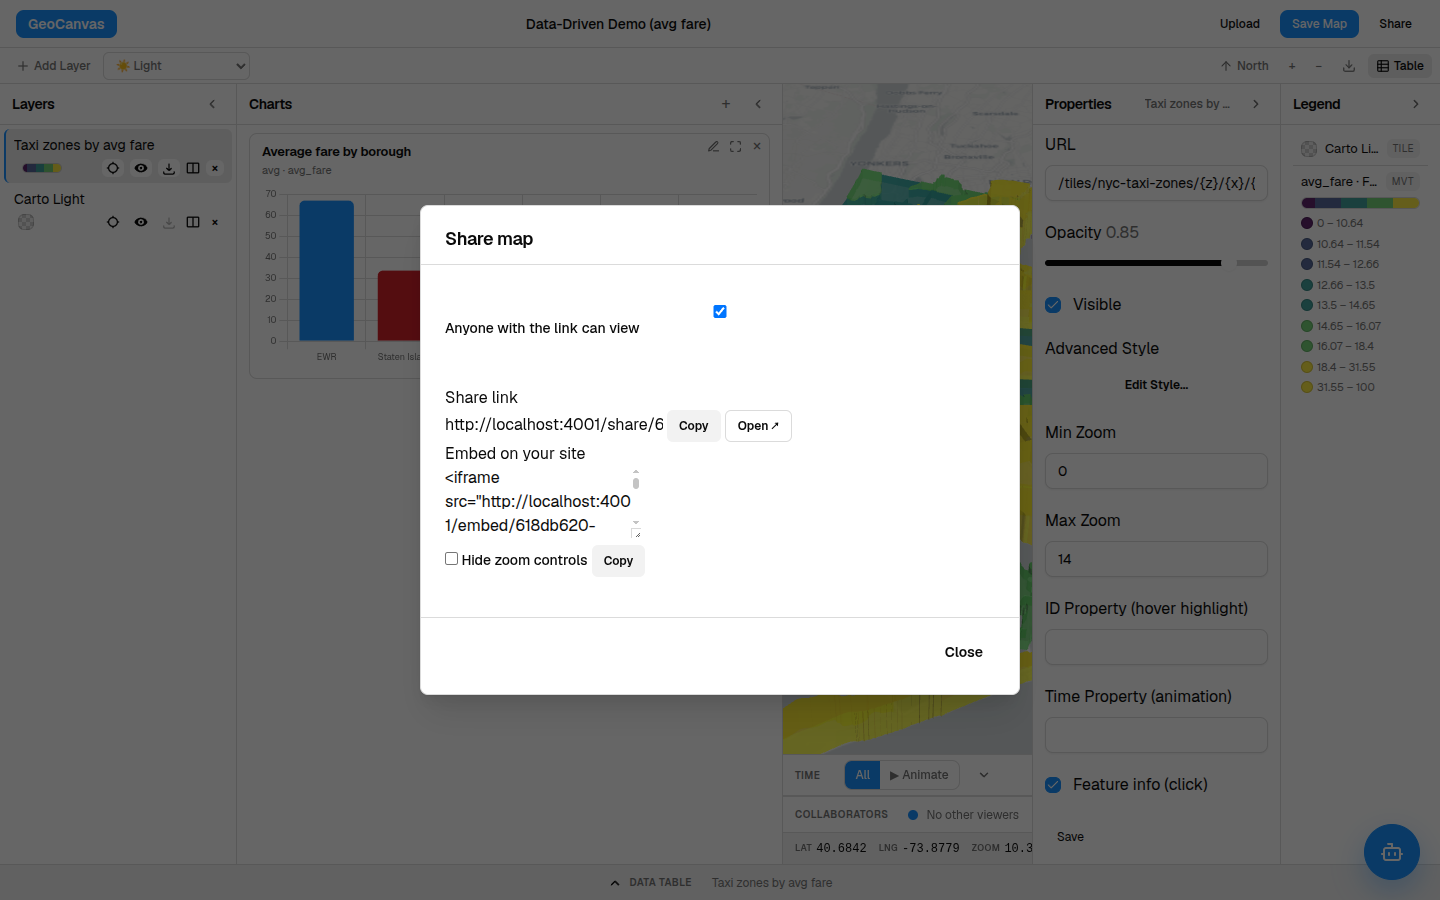
Save the map before you share it, and remember the switch is the only lock on the door — anyone you give the link to can open the map. Don't put anything private on a shared one.
For the branded viewer and pasting a map into your site, see Sharing maps and Embedding maps. And that's it — you've made and shared your first map. New to the panels and buttons? Tour the interface next.