Build up your map with layers
Stack, arrange and manage everything on the map.
You rarely want just one thing on a map. You want your data sitting on a backdrop, maybe a second dataset for context, with the important stuff on top and the quieter stuff tucked underneath. A GeoCanvas map is a stack of layers, and the Layers panel is where you build it — adding, hiding, reordering and tidying until the map looks the way you pictured it.
Where it all happens
The Layers panel
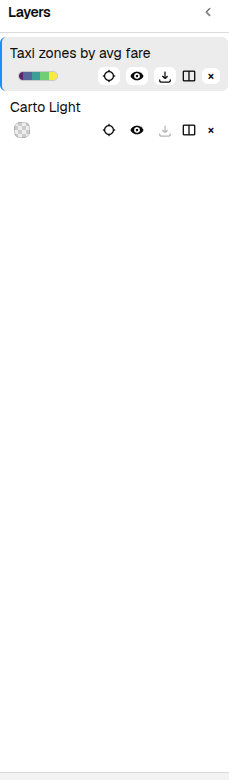
Open any map and you'll find the Layers panel in the top-left of the editor. Everything on the map gets one row there, each with a little colour swatch, the layer's name, and controls that appear when you hover. Click a row to select that layer — its settings open in the Properties panel on the right, where you fine-tune it or jump into styling.
Put something on the map
Add a layer
Click + Add Layer at the top of the panel and the Add Layer window opens. From here you can bring your own file or pick a dataset you already have — plus a couple of special kinds for when you want the map to summarise rather than just show.
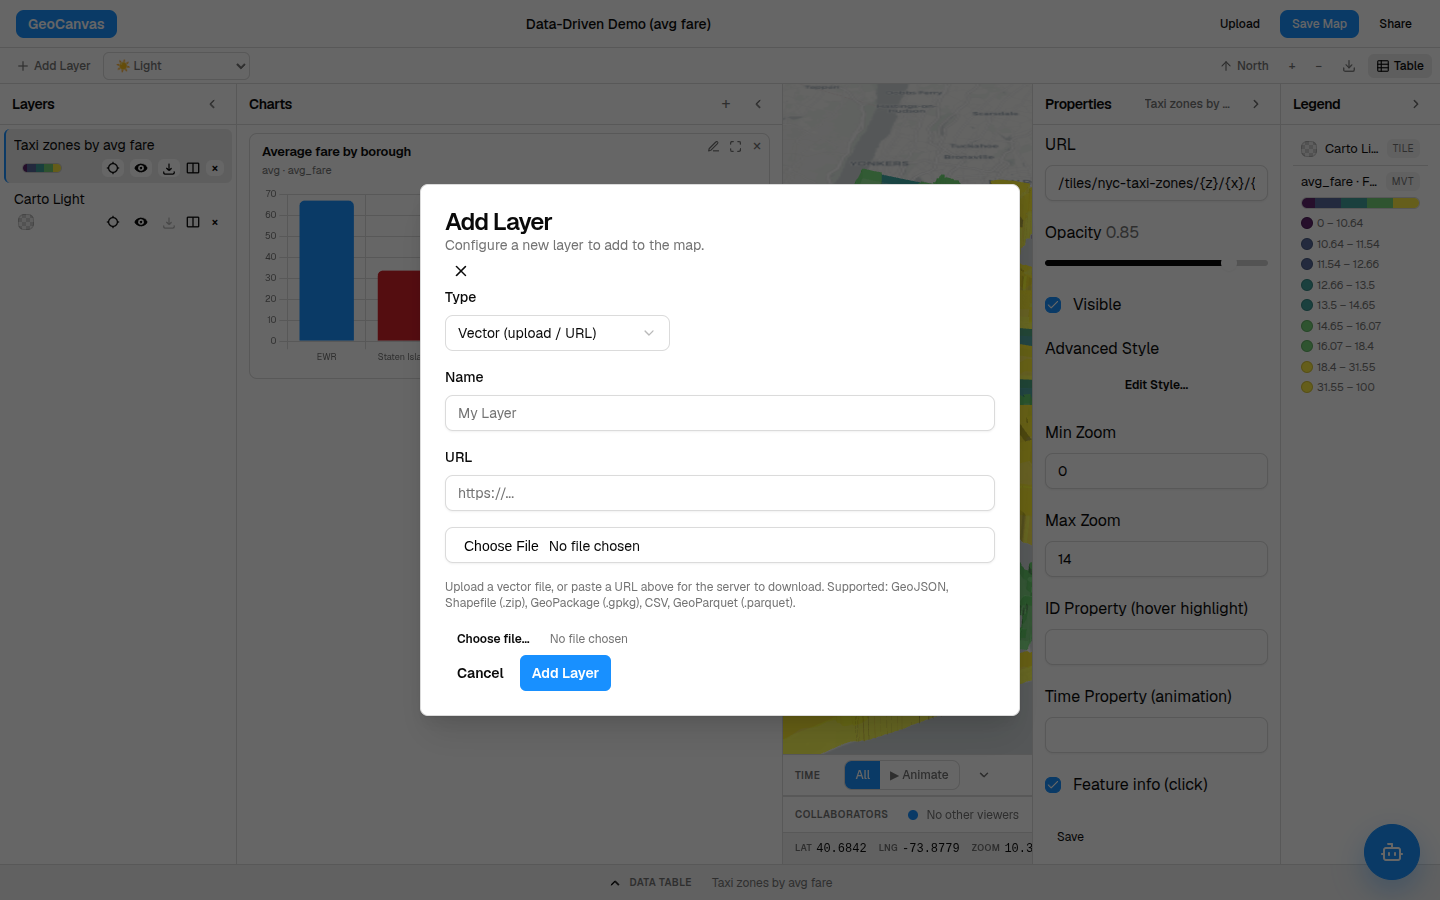
- Your own data. Choose a file from your computer and GeoCanvas brings it onto the map. The window lists every file type it accepts; the step-by-step is in Upload your data.
- A ready-made dataset. Pick something from your data catalog — anything you or a teammate added before is one click away, no re-uploading. This is how the NYC taxi zones land on a fresh map.
- A density heat map. Turn a cloud of points into warm-where-it's-busy colour for spotting hotspots at a glance.
- Hexagon bins. Group scattered points into tidy hexagons that count how many fall in each — cleaner than thousands of overlapping dots.
The heat-map and hexagon kinds have their own knobs — size, and what to count. They get the full walkthrough in 3D, time & advanced layers.
Manage each layer
What each row can do
Hover a row and its controls appear to the right of the name:
- The eye hides a layer without deleting it — handy for comparing "with and without", or quieting clutter. Click again to bring it back.
- Zoom to layer flies the map to frame that layer perfectly, so you never lose track of where your data sits.
- Open in new map opens the layer in a second view beside the first, for comparing two things side by side.
- Remove takes the layer off the map when you're done with it.
Decide what sits on top
Reorder the stack
The order of the rows is the order things draw: the top row sits on top of the map, the bottom row sits underneath. Drag a row up or down to restack. A good rule of thumb — keep filled areas low so labels and points read above them, and your background map at the very bottom so your data reads clearly over it.
Change the backdrop
Swap the background map
Every map sits on a background map — the streets-and-water canvas beneath your data. Use the background switcher to try a few looks: a clean light map, a dark one, a colourful one, or crisp satellite imagery. There's one background at a time and it stays pinned at the bottom; pick a new one to swap it, or choose the blank option to drop it for a plain canvas.
Try it
Build the taxi-zone map's stack
Here's the whole flow on the demo NYC Taxi Zones map — follow along on the live example.
- Add the data. Click + Add Layer, open your catalog, and pick NYC Taxi Zones. All 263 zones drop onto the map and it zooms to fit.
- Set a background. Use the background switcher to choose a clean light map — it slides in beneath the zones.
- Check the order. Make sure the taxi-zone row sits above the background; drag it up if it doesn’t.
- Hide and reframe. Toggle the eye to hide anything you’re not using, and use Zoom to layer to recentre.
- Make it say something. Colour the layer by average fare so the priciest zones — out toward Newark Airport at around $67 — light up. Full steps in Styling layers.
Your whole arrangement — order, hidden layers, background and styles — is saved with the map and restored when you reopen it, so you never lose your setup.
That's the rhythm of building a map: stack your layers, get them in order, hide what you don't need, and pick a backdrop that lets your data shine. From here, make a layer tell its story with styling, bring in more of your own data through uploads, or reach for the richer display layers in 3D, time & advanced layers.