Tour the interface
Find your way around the map editor so nothing feels hidden.
You've just opened a map and the screen is busy — a big map in the middle, panels stacked down the sides, buttons across the top. The only question that matters right now is simple: where is everything, and what is each part for? This page is your map of the map. Once you know which corner does which job, every other guide tells you exactly where to click.
The big picture
The map is the star
The whole centre of the screen is your map. Drag to pan, roll the wheel to zoom, and hold Ctrl while you drag to tilt it into 3D. Everything around it — every panel and button — is there to change what's on the map or to explain what you're looking at.
Throughout these docs we use one running example: New York City's 263 taxi zones, coloured by the average fare for a ride that starts in each. Manhattan stays cheap at around $12, far-flung Staten Island climbs to about $34, and the zone around Newark Airport tops out near $67. Open it as the live example map and follow along.
On the left
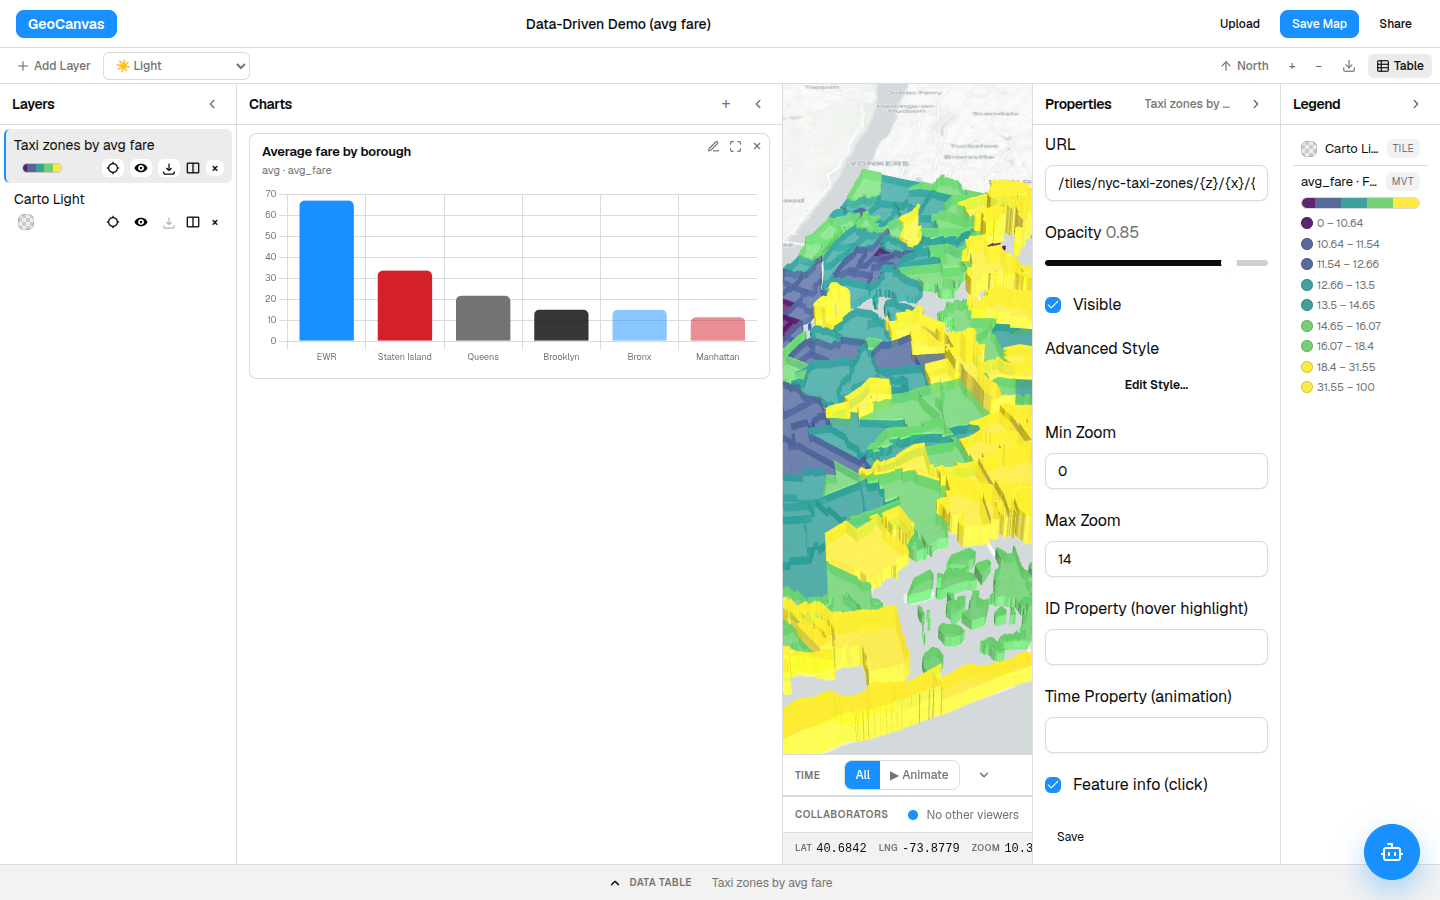
The Layers list: what's on the map
Each dataset you add becomes a layer, and the Layers list on the left holds them all, stacked top to bottom like a deck of transparencies. It's your table of contents: show or hide a layer, drag to reorder which sits on top, or click one to start working on it. See Working with layers.
On the right
Properties: how a layer looks
Click a layer and its appearance settings land in the Properties area on the right — how see-through it is, whether it's showing, and an Edit Style button. That's where you colour each zone by a number, so the expensive corners of the city light up while the cheap ones stay pale. See Styling layers.
The key
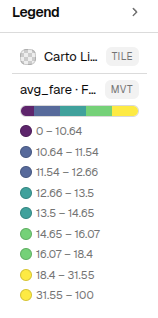
The Legend: what the colours mean
The moment a layer is coloured by a number, the Legend appears just below Properties and explains it for you — a colour ramp with labelled bands, so anyone looking knows that a pale zone is a cheap ride and a deep one is a costly one. You never draw it by hand; it writes itself to match your styling. See Legends.
The numbers
Charts and the data table
Sometimes you want the actual figures, not just the colours. A chart sums them up — average fare by borough, tallest bar first — and the data table along the bottom gives you one searchable, sortable row per zone. See Charts & data tables.
Across the top
Share it, or just ask
Two buttons round out the tour. Share, up top, hands you a link anyone can open and a ready-made snippet to drop the map into your own site — see Sharing maps. And the assistant button opens GeoChat, where instead of hunting through menus you type a plain question like "Which zones have the highest average fares?" and watch it answer right on the map — see GeoChat AI.
Want the map to fill the screen? Every panel collapses to a thin strip — tuck the side rails away when you just want to look, and bring them back when you want to make a change.
Find your feet
A one-minute orientation
- Open the example. Load the live taxi-zone map. The colourful map fills the centre.
- Glance left. The Layers list shows what is on the map.
- Glance right. Click the layer — Properties shows how it looks, and the Legend below it explains the colours.
- Ask a question. Open the assistant and try "Which zones have the highest average fares?"
That's the whole editor — map in the middle, what's-on-it on the left, how-it-looks on the right, the numbers along the bottom, share-or-ask up top. Ready to build one? Start with Working with layers, or browse everything you've added in the data catalog.