Answer your own custom questions
Go beyond the built-in tools when you have a very specific question.
Most of the time, GeoCanvas hands you the answer with almost no effort — a chart to compare groups, a colour-by-the-numbers map to show a pattern at a glance. But every so often you have a very specific question in your head, one with its own filters and cut-offs, and none of the ready-made tools quite gives it to you. When you need that exactness, GeoCanvas has a query tool: you pose your precise question and get back a clean table of the answer.
When you need it
When the ready-made tools aren't specific enough
The built-in tools are tuned for the common questions, and they cover a great deal: the average fare by borough, the priciest zones, where the numbers run high or low. But power users reach the edge of "common" quickly. You don't want the average fare — you want the average fare only for zones with more than 500 trips, grouped by borough. That's a precise mix of filtering and grouping that no single button offers. The query tool is built for exactly this: you decide which rows to keep, how to group them, and what to measure, and nothing is chosen for you. It trades one-click convenience for total control.
Where it lives
Open the query box and ask
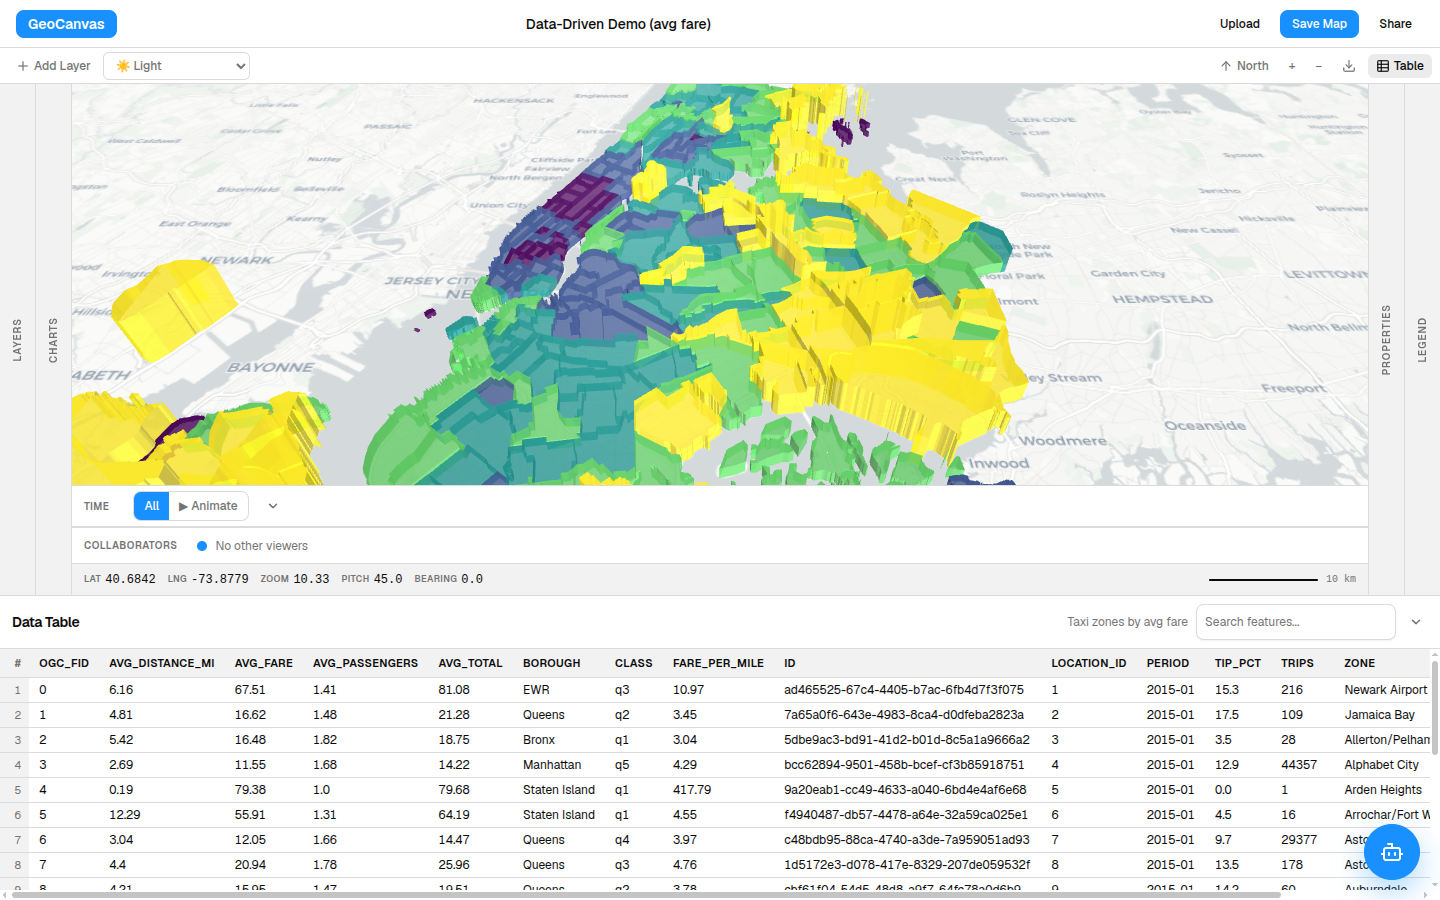
Open the query box from the editor's data tools and type your question in. You're stating it in a precise form rather than a loose sentence, but the shape is simple — name what to measure, which rows to keep, and how to group them — then run it. On the demo NYC Taxi Zones map the headline fares are easy to spot (about $12 in Manhattan, climbing to about $34 on Staten Island); the query tool is how you go past the headline and pull out your own exact cut of the data.
What you get back
A table you can read — or map
Run the question and the answer appears as a plain table, one row per result, right there in the editor — sort it, search it, read it straight off.
From there you have two moves. Read the numbers and you're done. Or turn the result into a new map layer — the rows you just pulled become their own coloured layer that you can keep, restyle, reorder and share, exactly like any other.
Don't want to phrase the question yourself? Ask GeoChat in plain English instead — it composes the same query for you, shows you exactly what it asked so you can trust the answer, and drops the result straight onto the map. The query tool is the precise path; GeoChat is the conversational front door to it.
Try it
Ask one exact question
- Open the query box. Find it among the editor’s data tools.
- Ask your exact question. Say what to measure, which rows to keep, and how to group them — then run it.
- Read the table. The answer appears as rows you can sort and search on the spot.
- Keep it as a layer (optional). Turn the result into a new map layer to colour, reorder and share.
That's the whole point of the query tool: the answers that don't fit a button. For the common questions, a chart or the data table is faster; for an answer in plain conversation, GeoChat writes the query for you. Try any of them on the live taxi-zone map.