Reuse your data across maps
One home for every dataset you add, ready to drop on any map.
You added a dataset once — say the NYC taxi zones — and now you want it on more than one map: the fares map you're building, a copy for your team, a version embedded on your site. You don't want to upload the same file again and again. The catalog is where that becomes easy — one home for every dataset you've added, ready to drop onto any map.
These steps use the demo NYC Taxi Zones dataset — 263 neighbourhood zones, each with its average taxi fare — the example threaded through these docs. Browse everything you've added at your catalog.
What you want to do
Add it once, use it everywhere
Every dataset you bring into GeoCanvas — whether you upload a file or start from a ready-made demo — is kept for you in one place. You never have to add it twice. The same dataset can sit behind a dozen maps at once, so you spend your time making maps instead of re-uploading data. The catalog is how you keep all of it tidy, findable, and labelled so the rest of your team knows what each one is.
Find your data
Browse the catalog
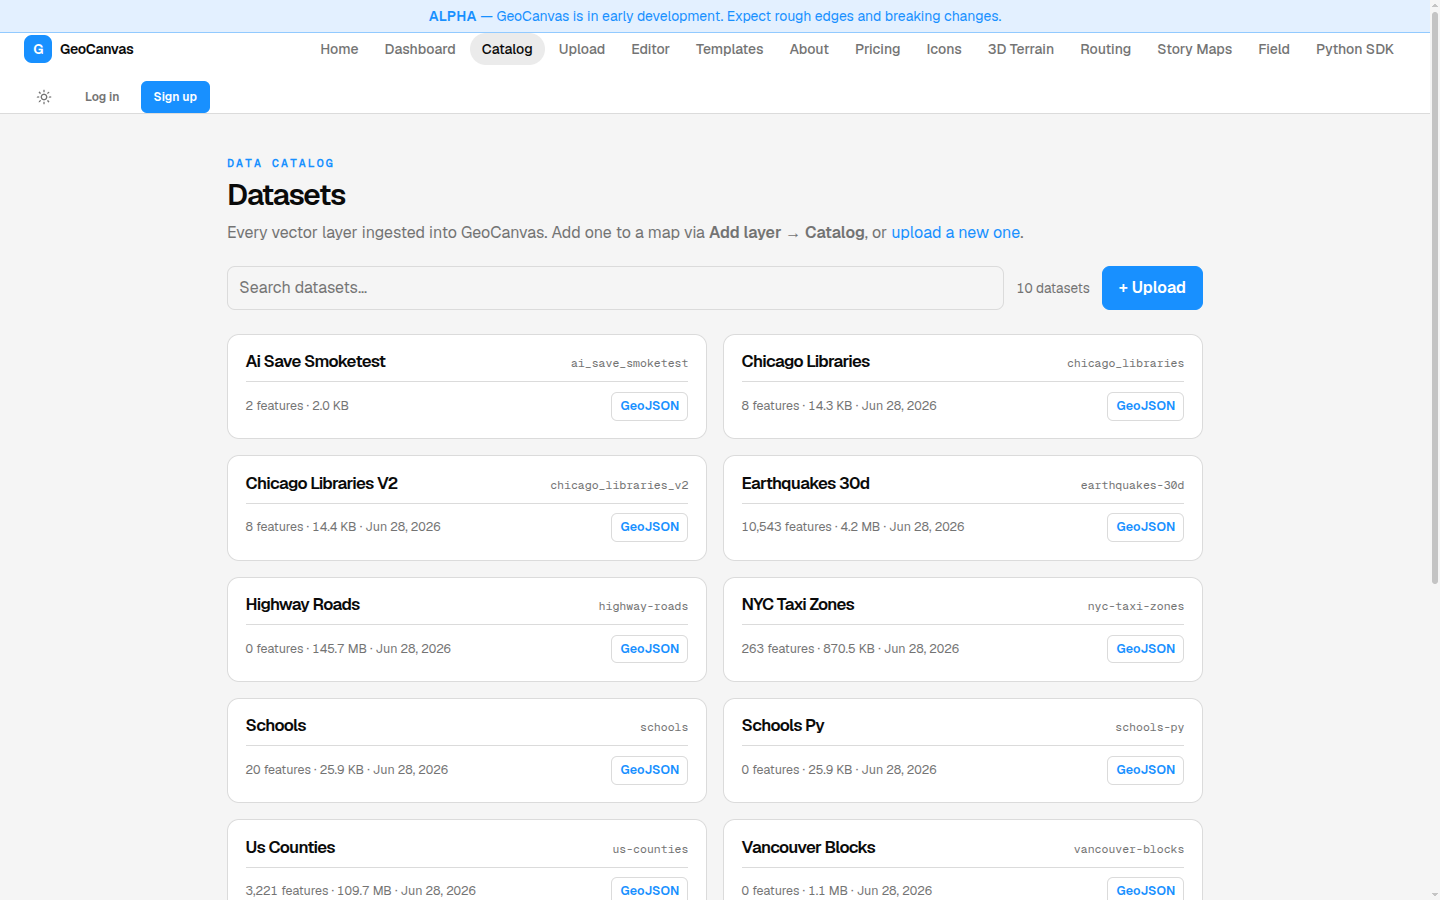
Open your catalog and you get a tidy grid of cards, one for every dataset you've added. Each card names the dataset and shows a quick line about it — roughly what's inside and when you added it. Start typing in the search box and the grid narrows as you go, matching names, descriptions and tags, so even a long list stays easy to scan.
Know what you've got
Open a dataset's page
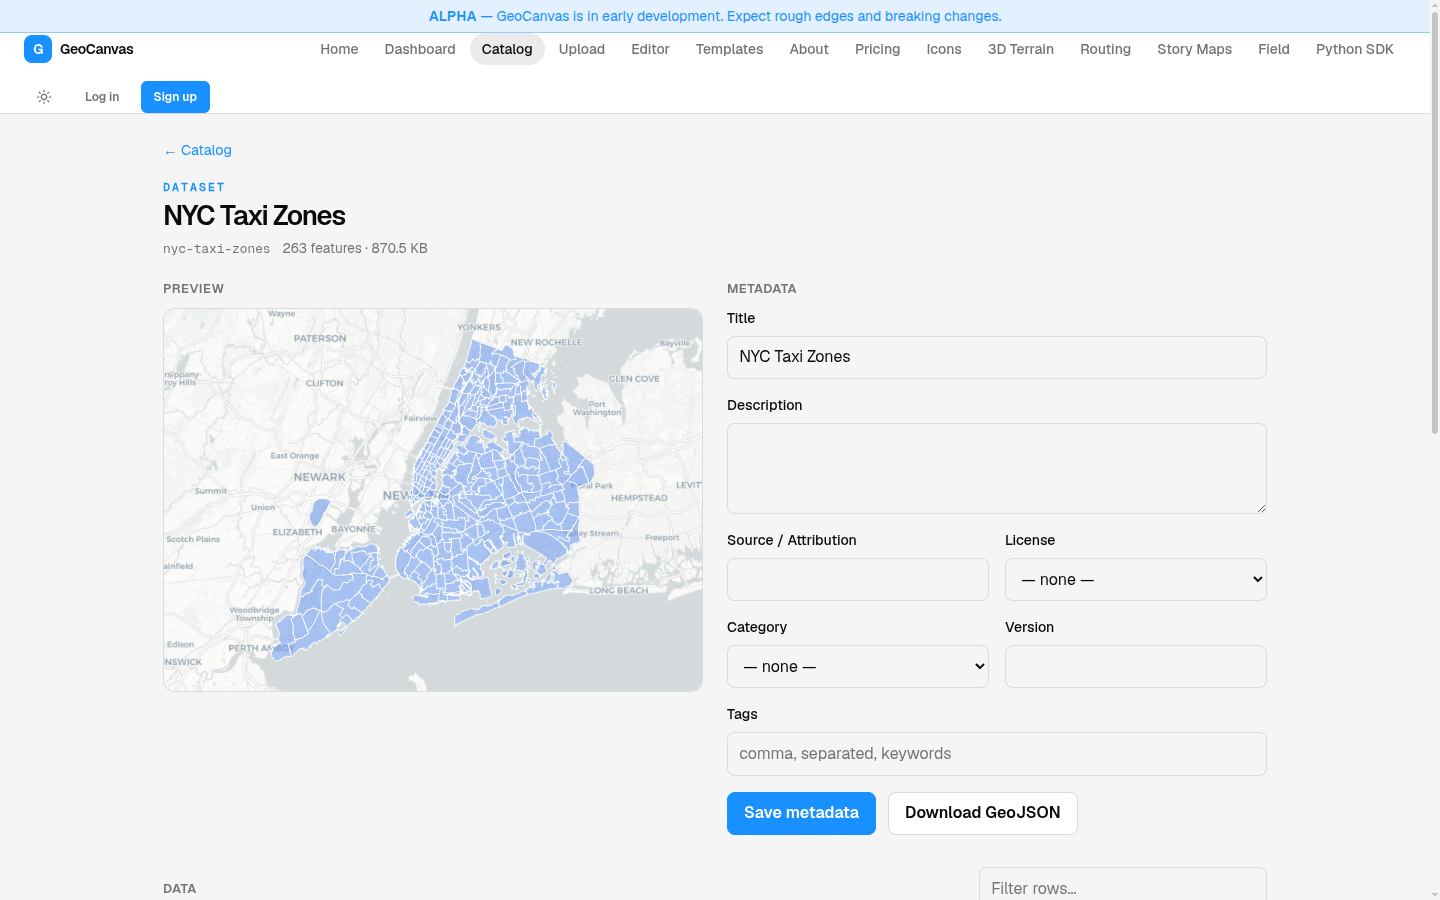
Click any card to open that dataset's own page. It's the place to get to know a dataset before you put it on a map, and it has three parts:
- A map preview. See the dataset's shape and where it sits in the world at a glance — a quick sanity check that it's the right data.
- A place to describe it. Give it a clear title, a short description and a credit line for where the data came from, then save. This is how a teammate opening the catalog later knows what the dataset is and whether to trust it.
- A peek at the rows. Scroll the actual contents — one row per zone — so you can confirm it really holds the average fares and neighbourhoods you expected.
The catalog is a shared space, so a good title and a one-line description pay off for everyone. A future you — and your teammates — will thank you for writing "NYC taxi zones, average fare per zone" instead of leaving it blank.
Reuse it
Drop it onto any map
Here's the payoff. Open any map and, in the Layers panel, start Add Layer. Instead of choosing a file, switch to the Catalog option and you'll see the same list of everything you've added. Pick one and it lands on the map, zoomed right to it, ready to colour.
- Open Add Layer. In the map editor, open the Layers panel and click Add Layer.
- Switch to the catalog. Choose Catalog instead of uploading a file — the dialog lists every dataset you've added.
- Pick your dataset. Click NYC Taxi Zones. It drops onto the map and the view zooms straight to it.
- Make it yours. Colour the zones by their average fare to build the choropleth — see Styling layers.
Because it's the same dataset every time, adding it to a second or third map costs you nothing — there's no extra copy to keep in sync. You can see the finished result on the live example map. Need to get a new dataset into the catalog first? See Upload your data. Once it's on the map, Working with layers covers what to do next.