What files can I use?
The everyday file types GeoCanvas accepts — just pick yours.
You've got a file — a spreadsheet, a download from a mapping site, something a colleague sent over — and one nervous question before you even start: will GeoCanvas take it? Almost certainly yes. GeoCanvas reads all the everyday map and data files, so most of the time you just pick yours and go.
The short answer
Most files just work
If your data lives in a spreadsheet, came out of a mapping program, or was handed to you as a small map file, it's almost certainly one GeoCanvas can read. You don't need to convert anything first, and you don't need to know what's inside the file — just bring it as it is.
Where to pick your file
Open Add Layer and choose it
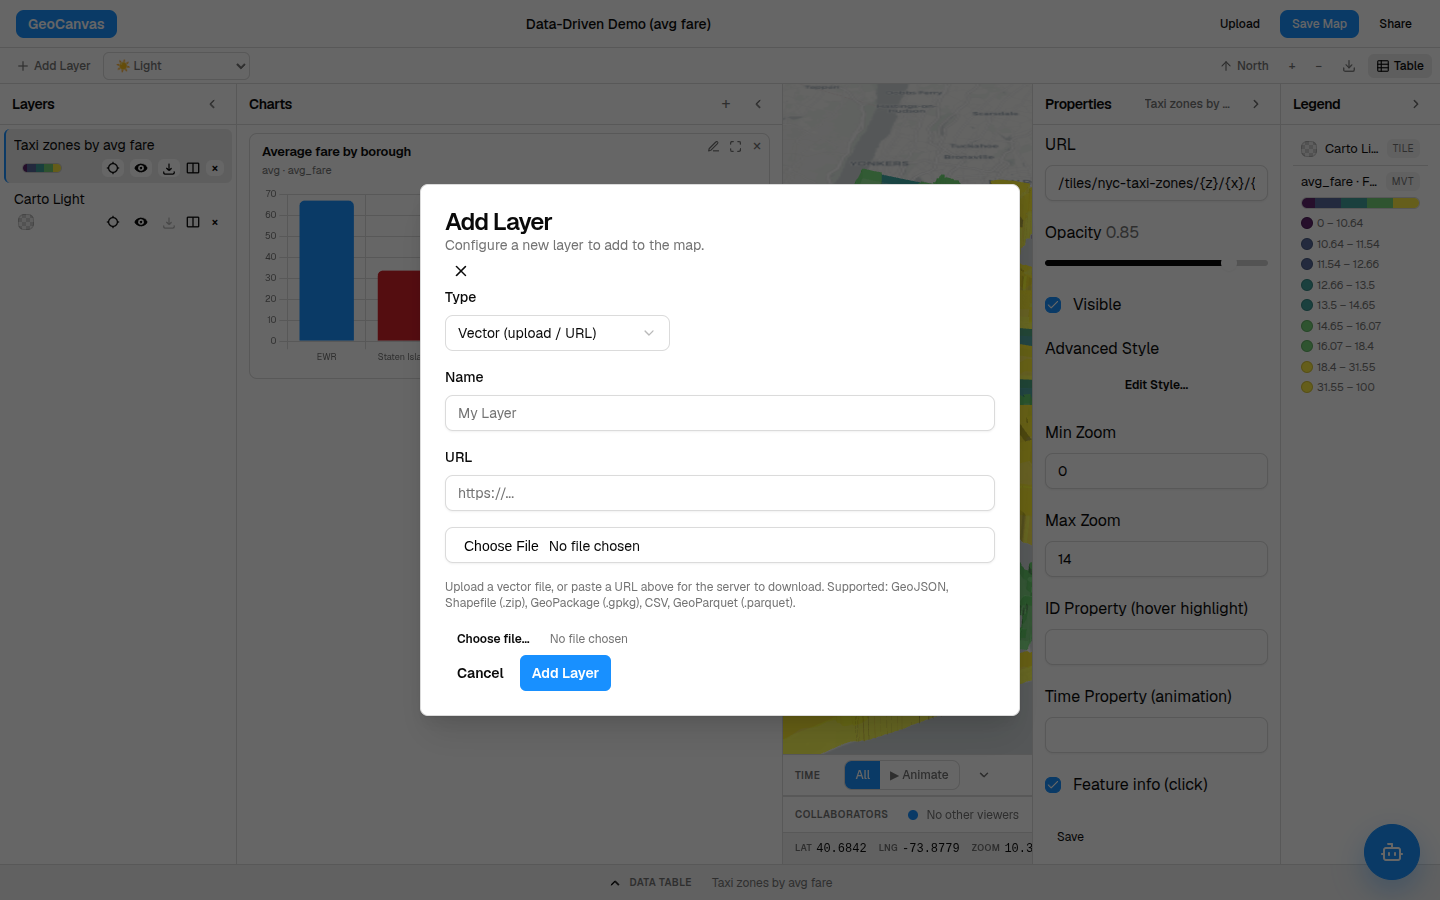
Click Add Layer in the editor. The window that opens lets you either choose a file from your computer or pick something you've already added from the catalog. Right there in the window it lists the file types it accepts, so you can check yours at a glance before you commit.
The file types
What you can bring
Here are the everyday types, described by what they actually are rather than by their innards:
| Type | Looks like | Good for |
|---|---|---|
| Spreadsheet (CSV) | A table of rows and columns, like in any spreadsheet app. | Points you already have as longitude & latitude — or a plain list of addresses. |
| Shapefile | A zip file exported from a mapping program. | Boundaries, regions and roads from GIS software. |
| GeoPackage | One tidy, self-contained map file. | An all-in-one export from mapping software. |
| GeoJSON | A lightweight map file that's really just text. | Shapes shared online or sent over by a colleague. |
| Data export | A single compact data file from an analysis tool. | Larger datasets an analyst or a script prepared for you. |
A shapefile is really a little bundle of files that have to travel together, which is why it comes as a single zip. That's completely normal — just upload the zip and GeoCanvas opens it up for you.
Spreadsheets
Bringing a spreadsheet
A spreadsheet is the most common starting point, and there are two ways GeoCanvas can place each row on the map. If your sheet has a longitude and a latitude column, it drops a point at each pair. If instead it has a column of addresses, GeoCanvas looks each one up and places it for you — no coordinates required. Either way, every other column rides along as something you can later colour by, chart or ask questions about.
Everything lines up
Layers from anywhere fit together
Bring a spreadsheet of points, a colleague's map file, and an export from a mapping program, and they all land on the same world map, in the right place, side by side — automatically. You never nudge anything into position by hand. That's how the example maps in these docs stack the NYC Taxi Zones — 263 neighbourhood shapes, coloured by an average fare that runs from about $12 in Manhattan up to $67 around Newark Airport — alongside other layers without a hitch. See it on the live example map.
Ready to actually bring your file in? Upload your data walks you through it click by click. Once a file's on the map it joins your data catalog, ready to reuse on any other map you make.