Go further
The extra tools for when the basics aren’t enough.
You've got the basics down — a layer on the map, coloured so it reads at a glance — and now you're wondering what else this thing can do. This page is your menu. It's a quick tour of the deeper tools, the ones you won't reach for every day but will be glad exist when a flat, two-dimensional map has more to say. Each one below comes with what it's for and where to find it.
Add a third dimension
Raise your data into 3D
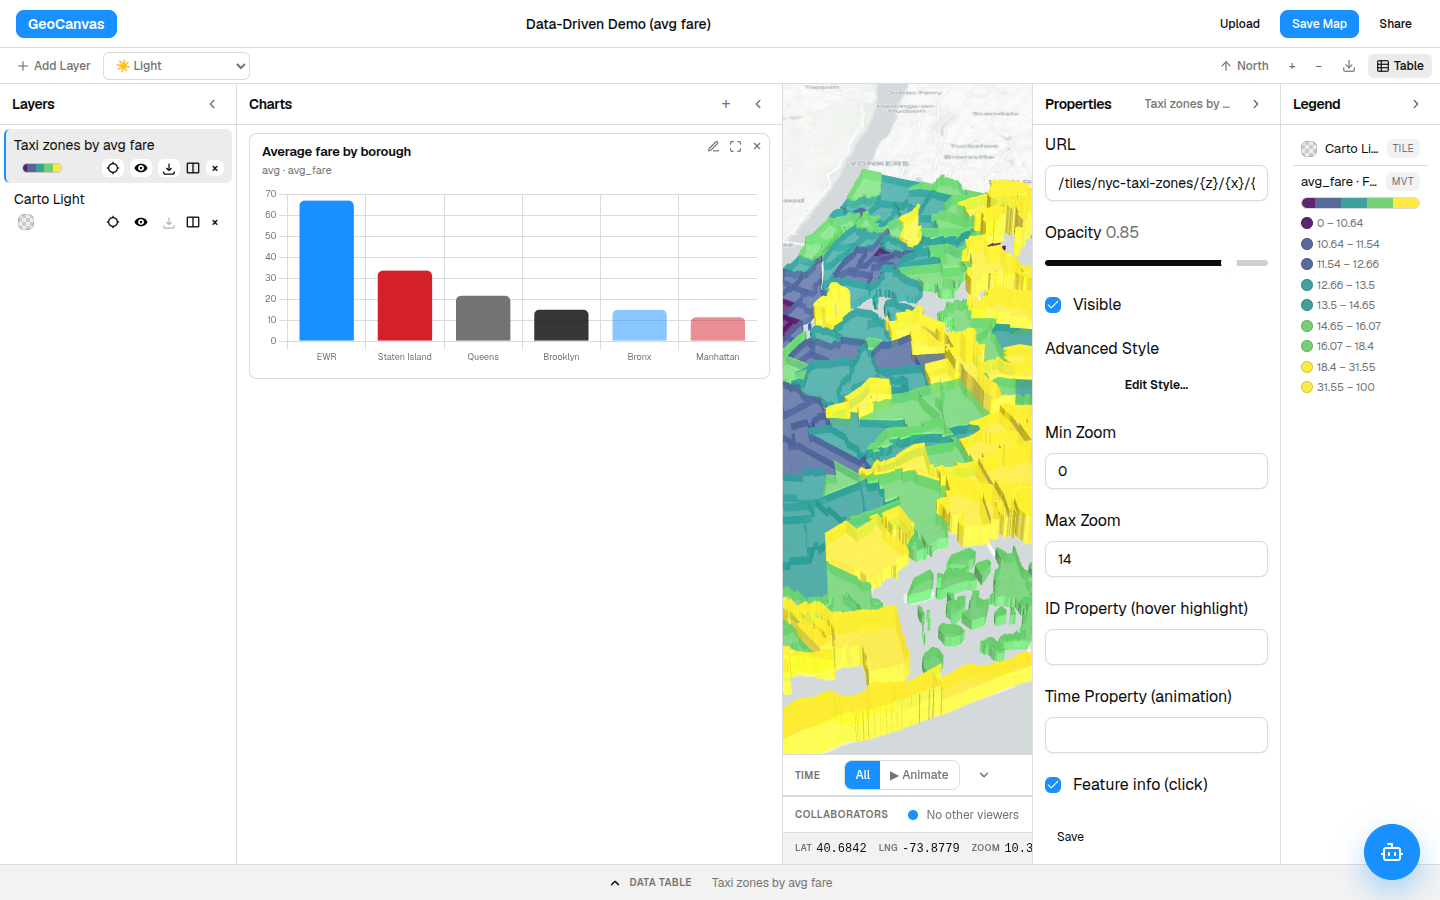
The quickest way to add drama is to let your numbers stand up off the map. In a layer's styling window you'll find a Height by setting — point it at the same number you're colouring by, then tilt the map, and the biggest values rise into tall columns you can read from across the room. On our NYC taxi map the dearest zones — around $67 out by Newark Airport — tower over Manhattan's $12 ones. Hold Ctrl and drag to tilt the camera; a flat, top-down view hides the height entirely. The full walkthrough lives in Styling layers, and you can see it on the live example map.
Real terrain
Drape a map over a real landscape
Sometimes the land itself is the story. GeoCanvas can lift the ground into real 3D terrain — mountains, valleys and ridgelines you can tilt and look across — and stand actual buildings up on top of it. Simple on/off controls switch the terrain and the buildings independently, and a tilt slider lets you lay the camera almost flat against the slopes for a dramatic, ground-level view.
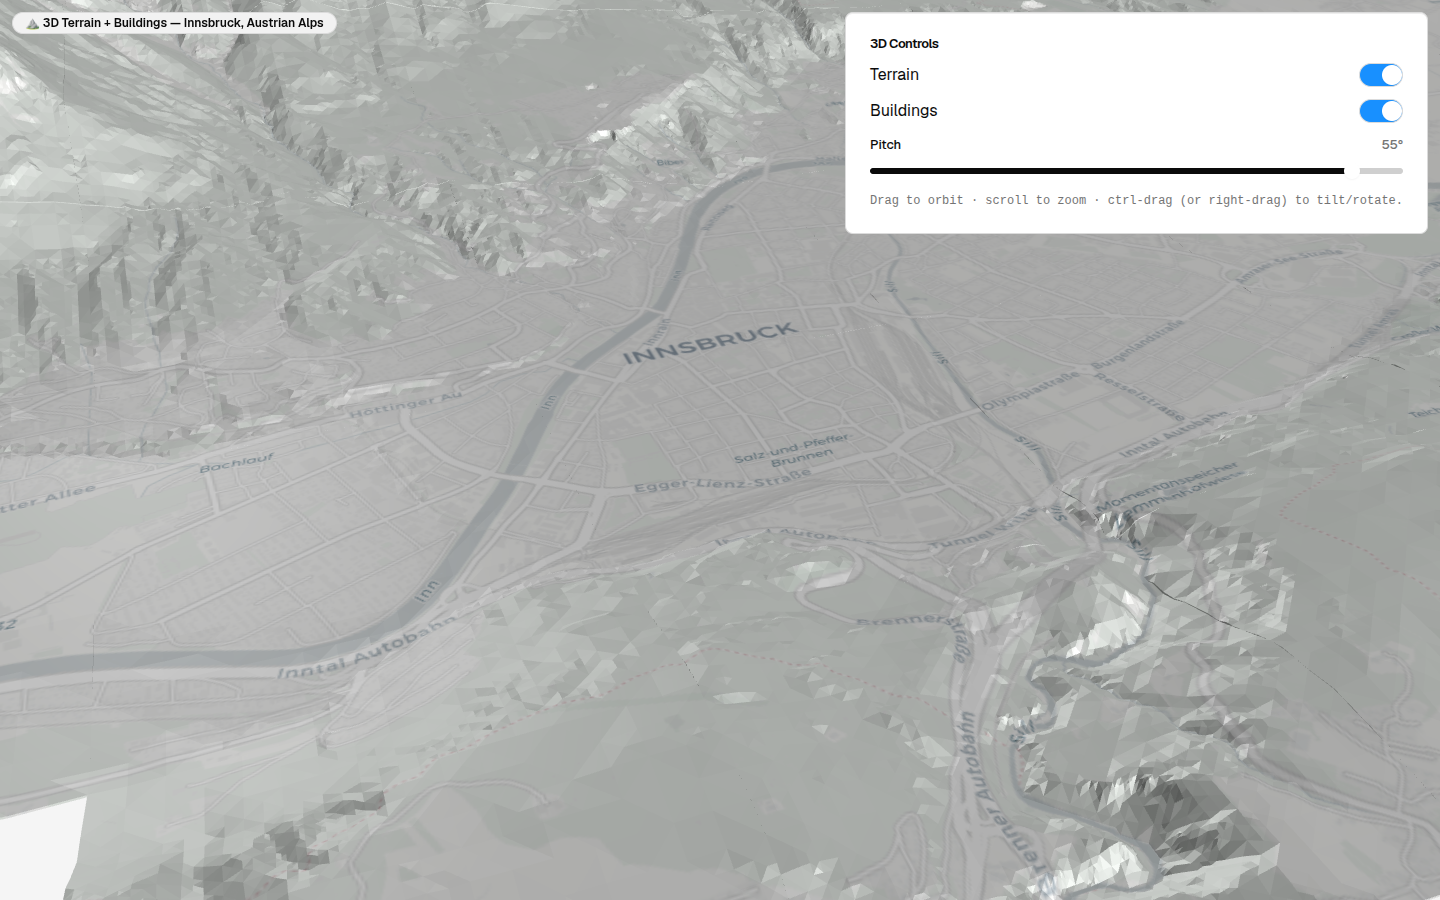
Terrain is one of the newer views — a great preview of where the 3D side of GeoCanvas is heading.
Watch it change
Play your data through time
If your data carries dates or times — trips by the hour, events over a month, totals by year — you can watch it unfold instead of seeing it all at once. When a layer has time in it, a Time bar appears along the bottom of the editor.
- Find the Time bar. It appears at the bottom of the editor whenever a layer with dates or times is on the map.
- Switch to Animate. The default, All, shows everything at once; Animate sweeps through time.
- Press play. Watch features appear and fade as the clock moves forward.
- Scrub to a moment. Drag the slider to jump to any point, or change the speed to slow things down or race ahead.
- Reset. Click All to clear the time filter and bring every feature back.
Tame the crowd
Show density when points pile up
Thousands of individual dots quickly turn into one unreadable blob. When you have a lot of points and what you really care about is where they cluster, two layer types turn the crowd into a clean picture. Add either one from the Type menu in the Add Layer dialog:
- Heatmap — a smooth wash of colour that glows hot where points pack together and fades where they thin out. Perfect for "where is the activity?"
- Hexagon bins — tidy hexagonal tiles, each shaded (and, if you like, raised into 3D) by how many points fall inside it, giving you a density map you can count.
Both are ordinary layers you add, reorder and recolour like any other — see Working with layers and Styling layers.
Side by side
Compare two maps at once
When you want a before-and-after, or to weigh one styling choice against another, you don't need two browser tabs. Each layer's row in the Layers panel has a split button that opens a synced side-by-side view. Pan or zoom one side and the other follows along, so you're always looking at the very same place — just two ways of seeing it.
Tell a story
Walk someone through a place
For presenting rather than exploring, GeoCanvas can turn a map into a guided story: a full-screen map that glides from one spot to the next as your reader scrolls down a column of text. It's the difference between handing someone a map and taking them on a tour — ideal for walking an audience through a neighbourhood, a journey, or a change as it happened.
Reach for these once the basic map — coloured, explained by its legend and shared — has more to give. And when you'd like to drive any of it from your own scripts, that's For developers.